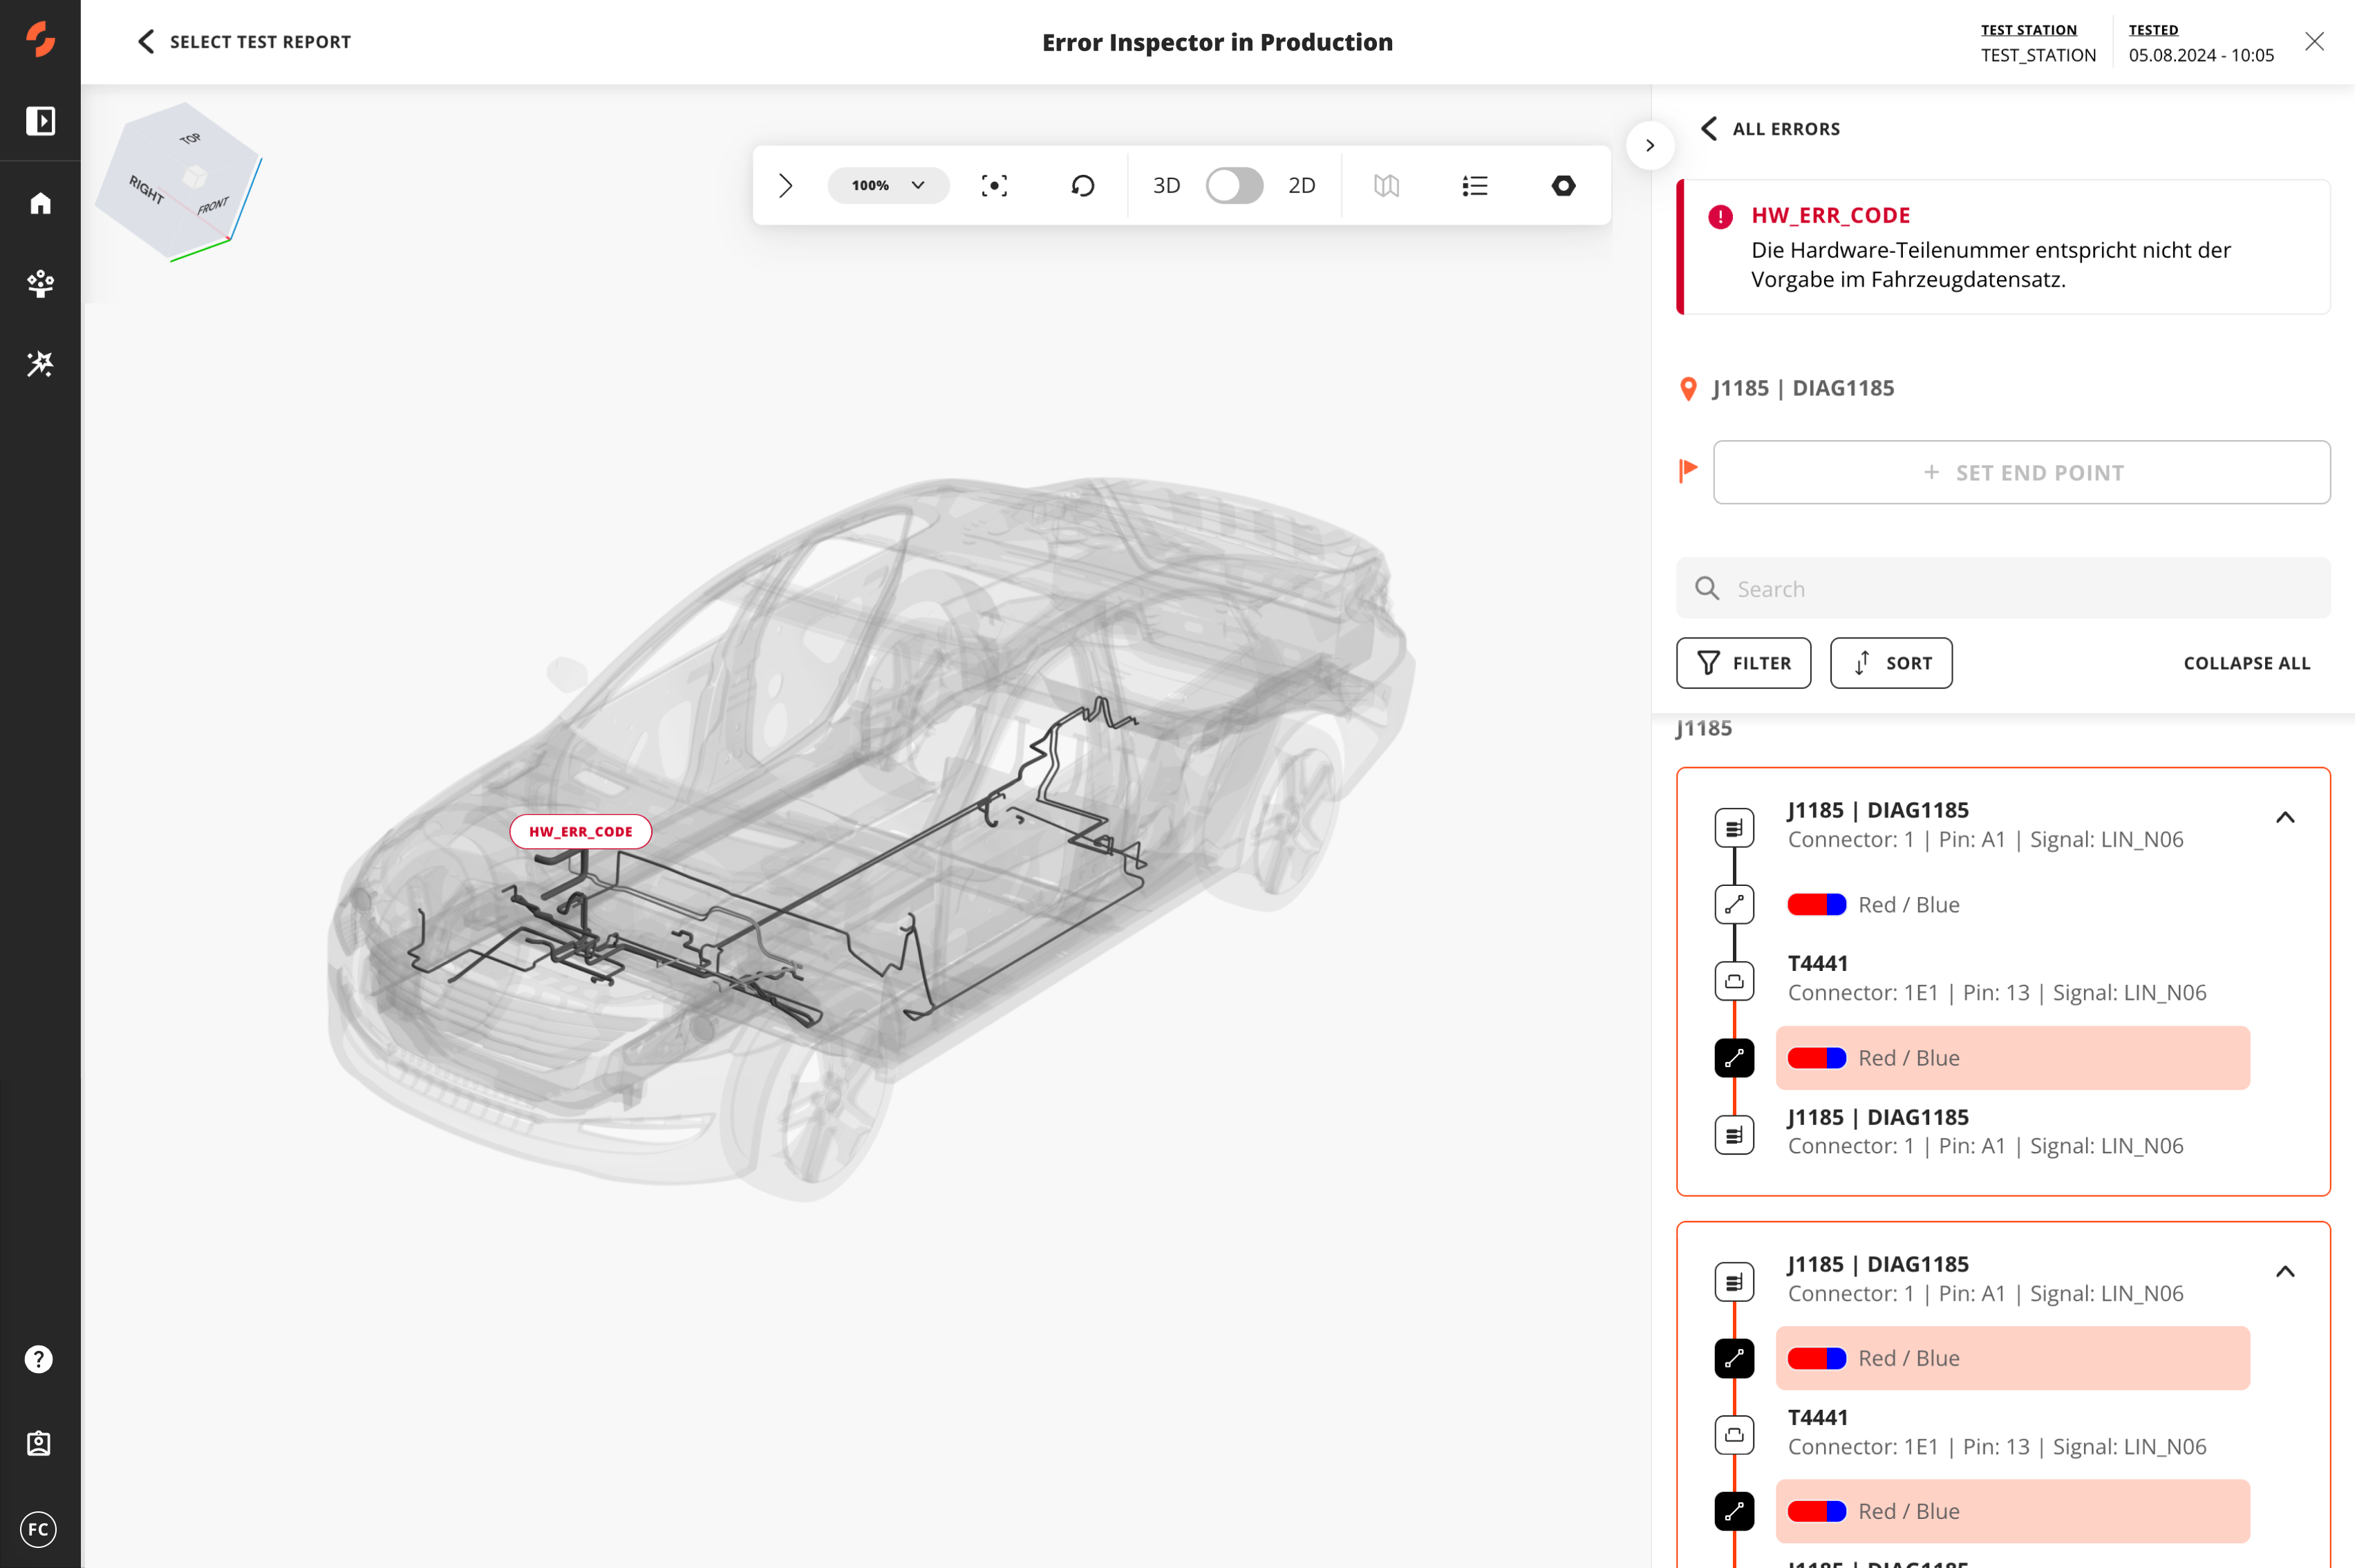
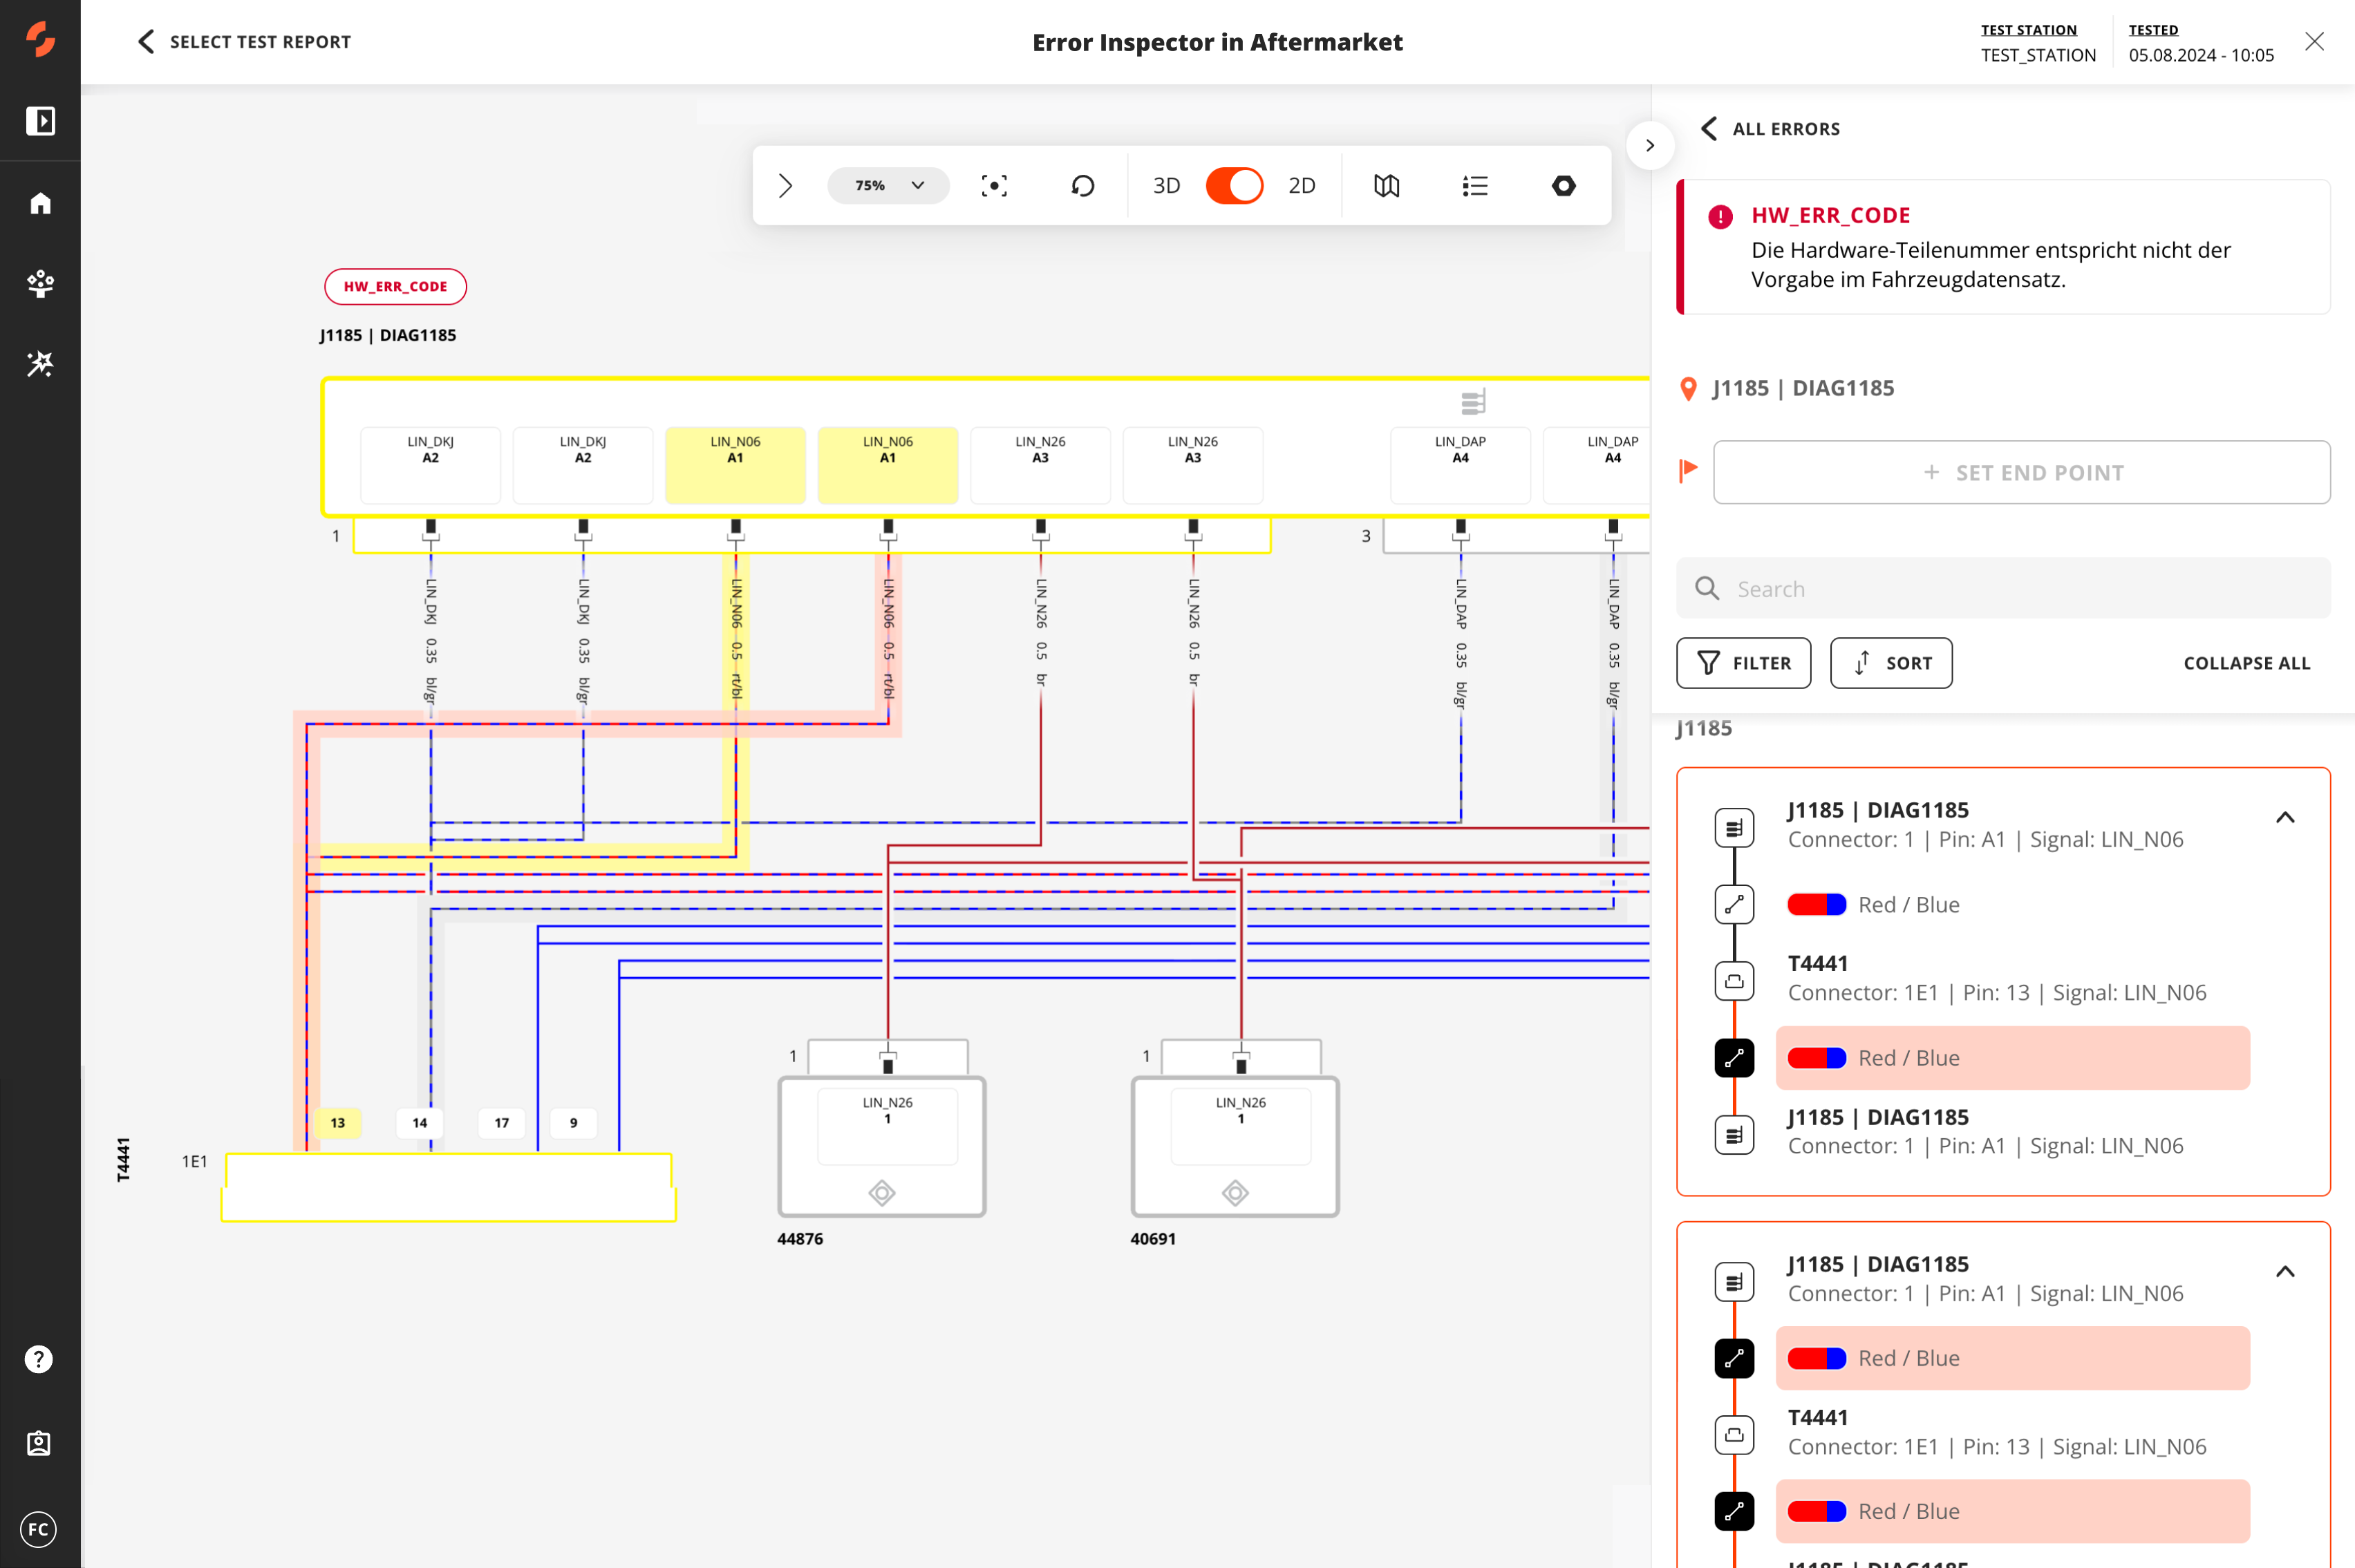
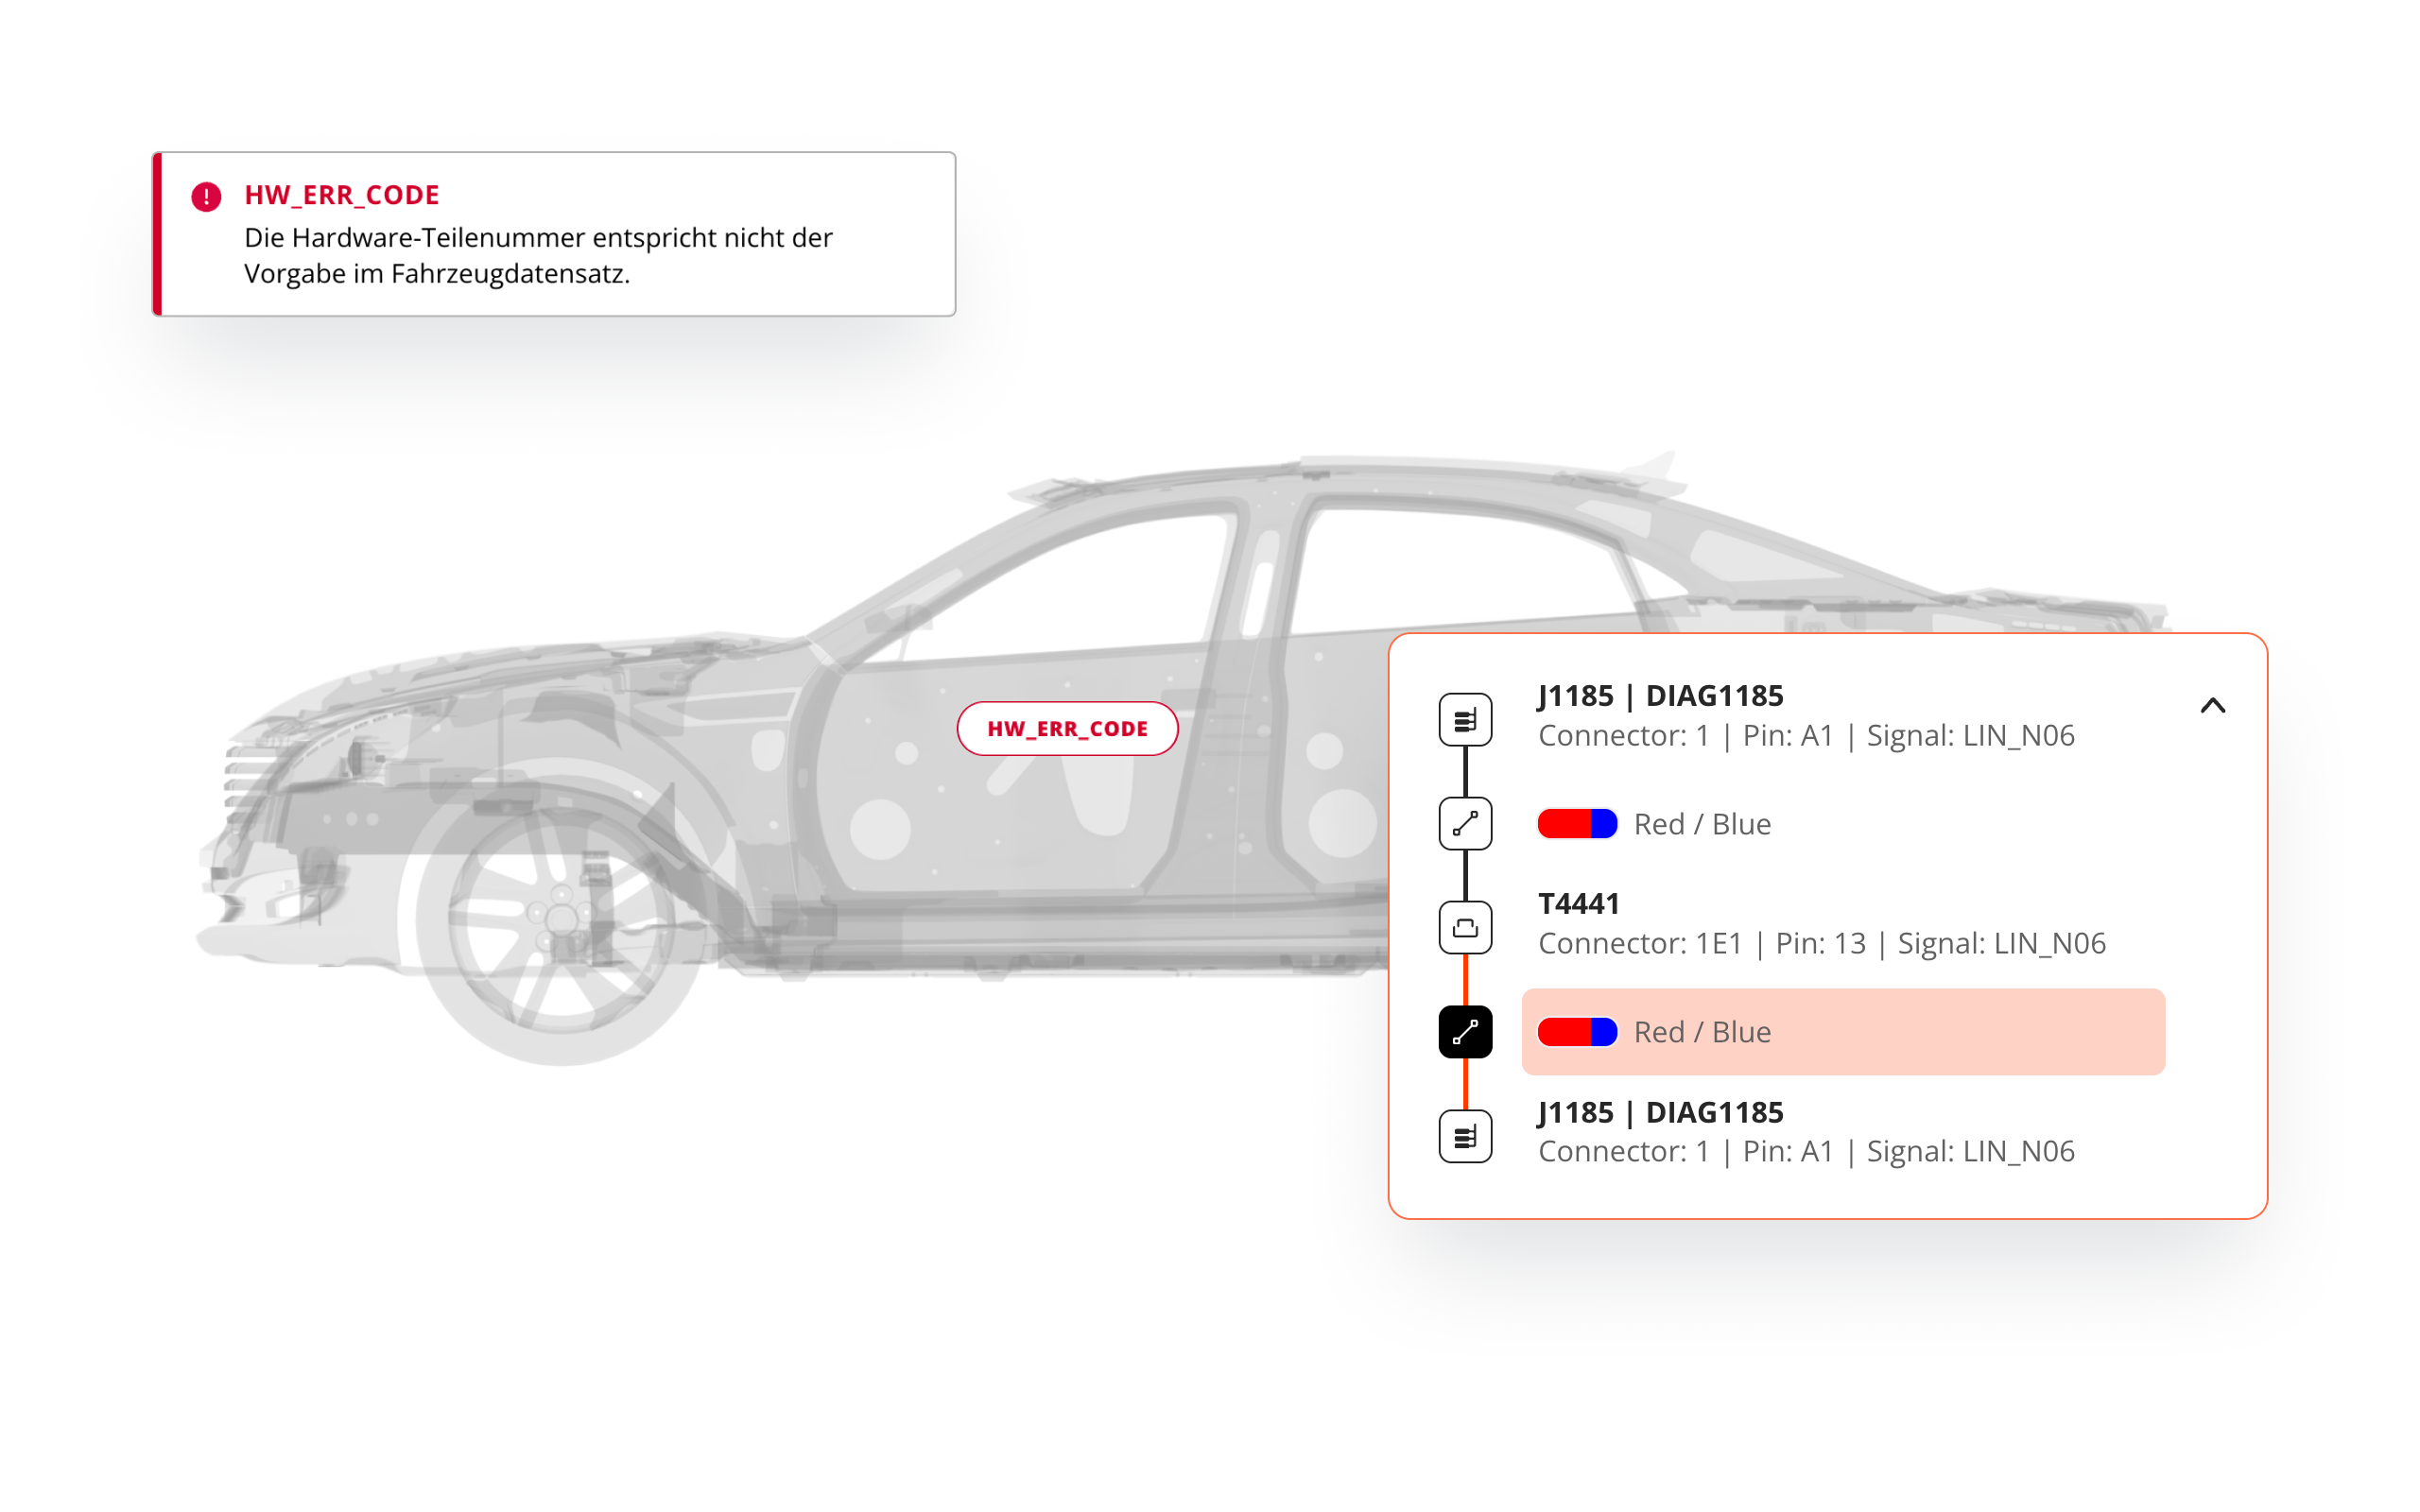
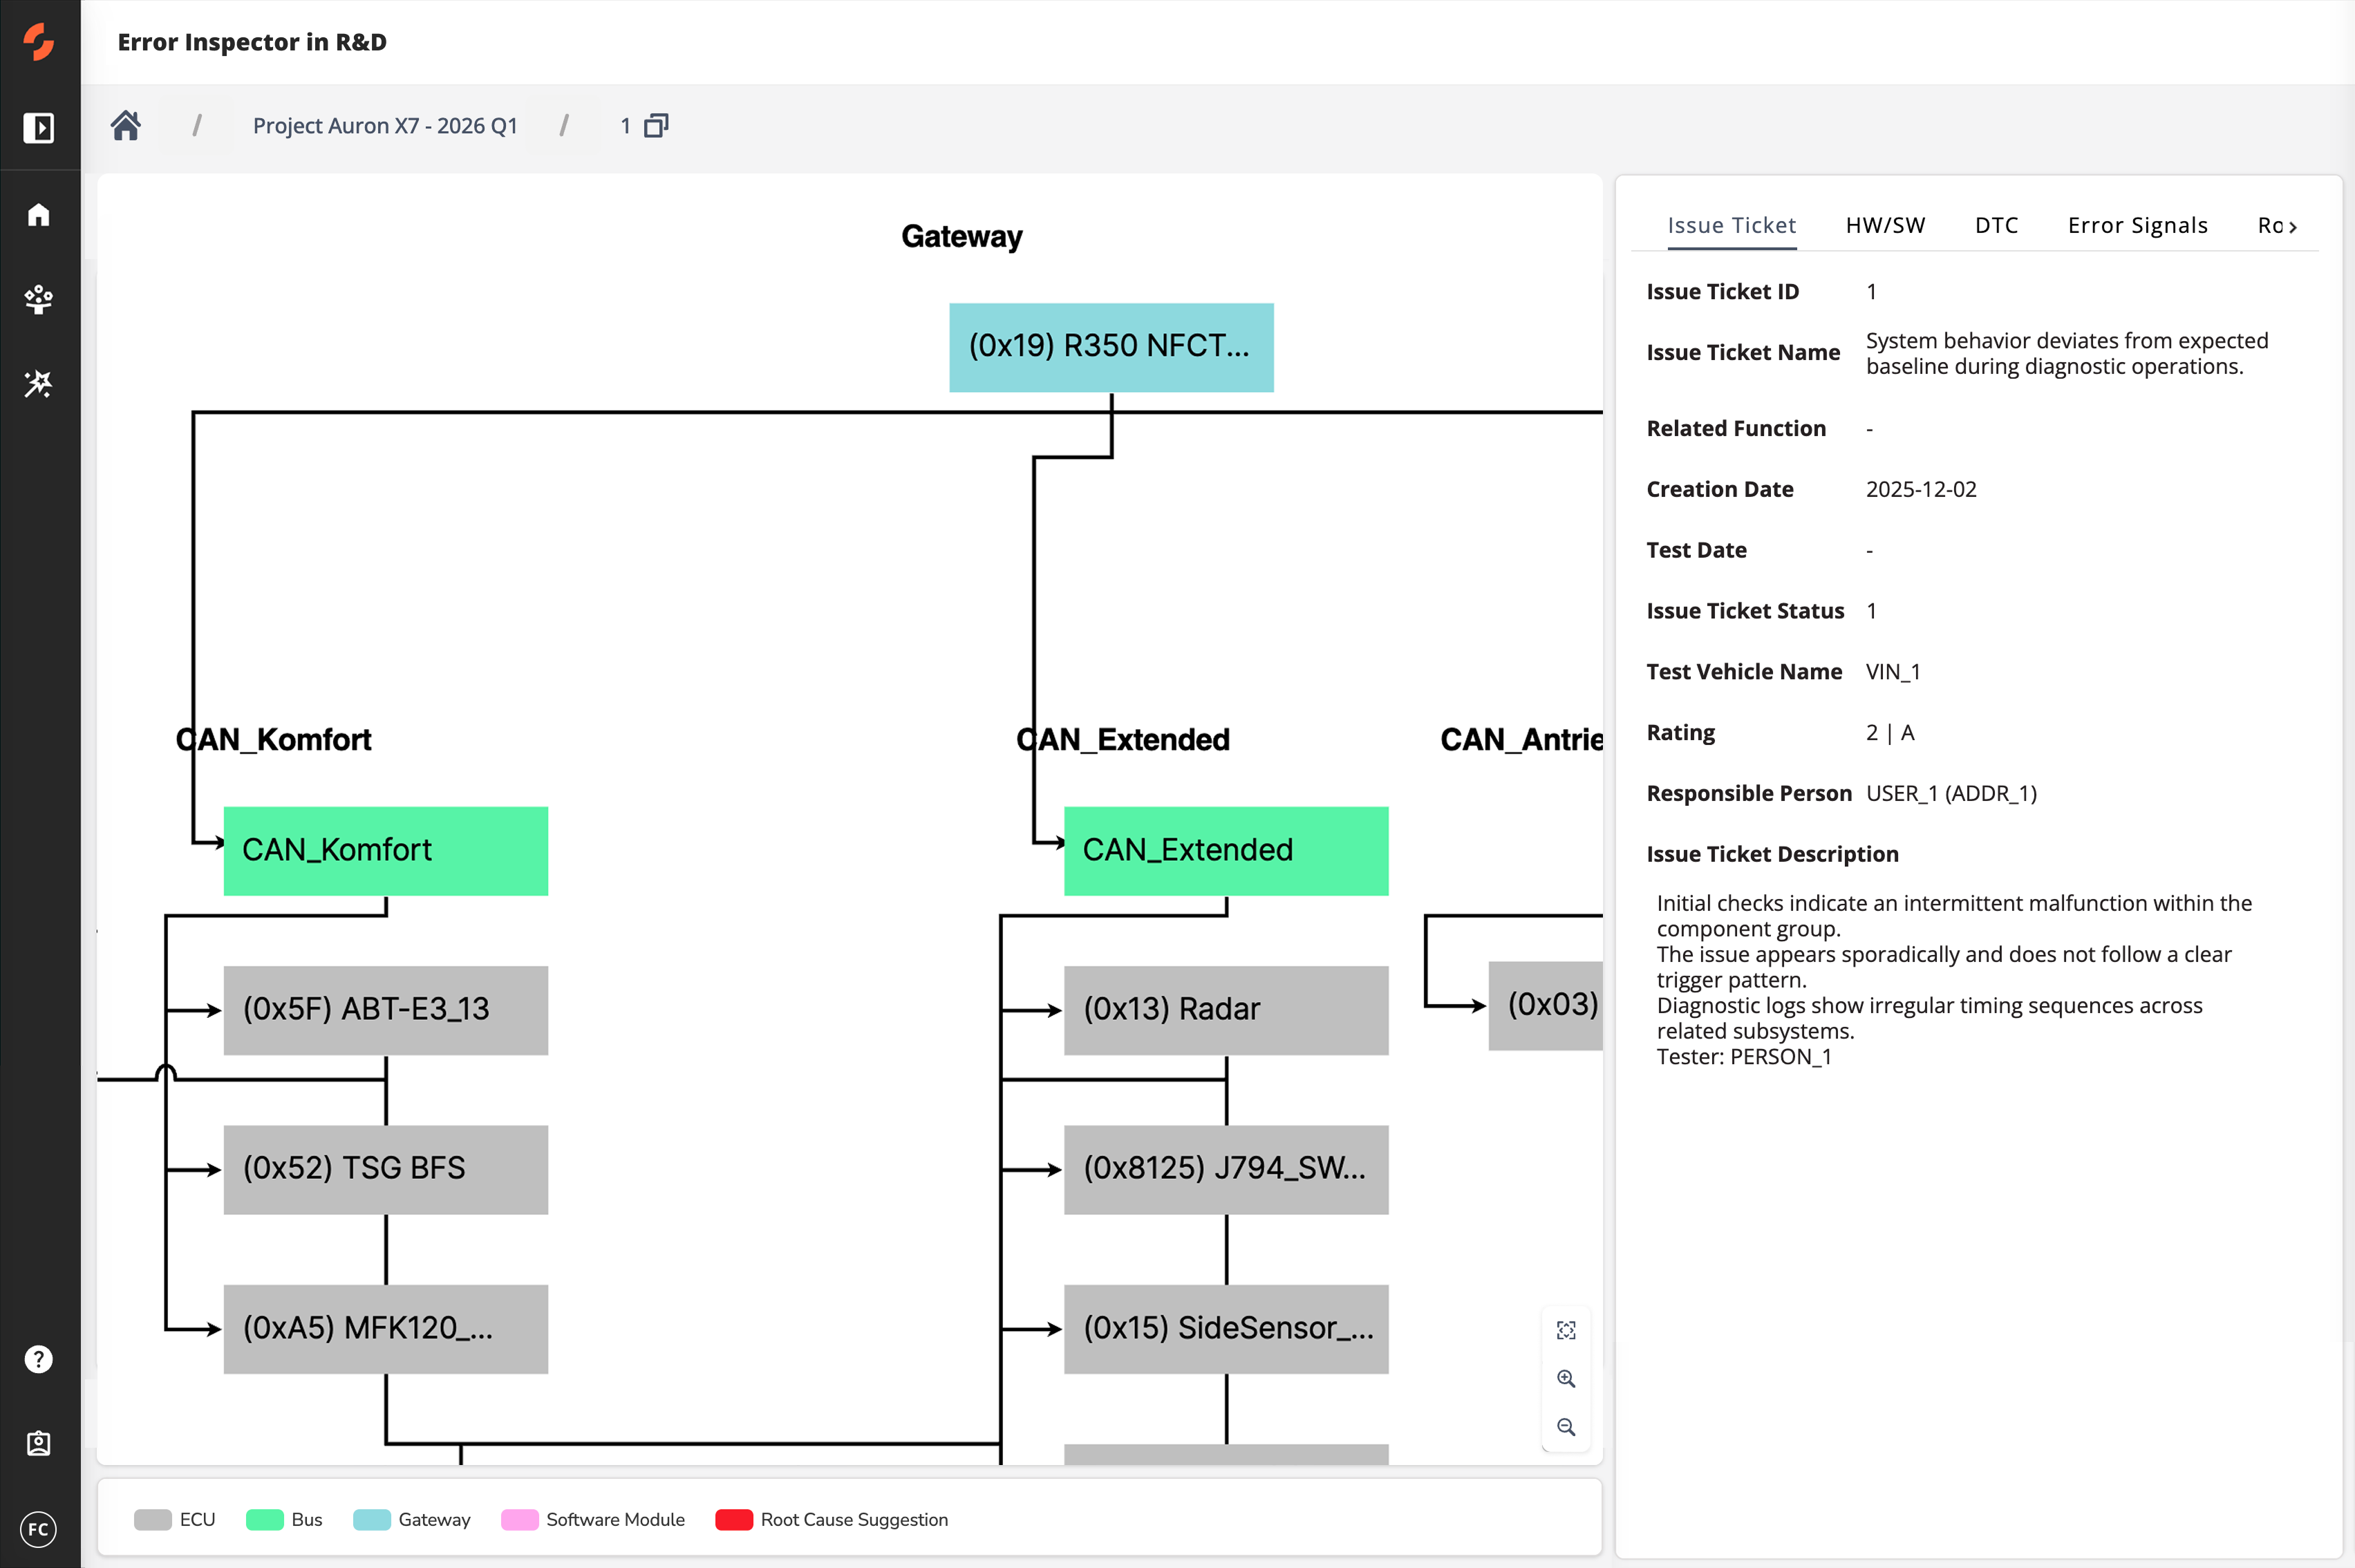
<img height="1" width="1" style="display:none;" alt="" src="https://px.ads.linkedin.com/collect/?pid=5292226&amp;fmt=gif">
Skip to content

Error Inspector

Find and solve issues earlier across the lifecycle

Error Inspector empowers your teams to identify and solve electrical, electronic, and software issues earlier in the lifecycle, reducing troubleshooting time and increasing system reliability. By linking errors to dependencies, it accelerates resolution and improves product quality, preventing costly delays in R&D, Production, and Aftermarket.

Find and solve issues earlier across the lifecycle

What can you achieve with SPREAD's solutions?

up to
70%
reduced error search time
up to
30%
higher first-pass yield
up to
25%
increase in first-time-right rate

Trusted by


Use Cases
Error Inspector

What types of data does SPREAD connect and analyze?

SPREAD integrates data from multiple engineering systems and unstructured sources to provide complete traceability from issues to root cause. It connects and contextualizes:

Data Type Description Typical sources File Formats needed
Issue Tickets Description, criticality, affected car, software release, affected function incl. linked parts & software, … Company specific system
Traces Chronological recording of events, signals and system states collected during the operation/testing of a vehicle. It is used to analyze system behavior – scope: signals Company specific system
.mf4 .mdf
Diagnostic Trouble Code (DTC) Code which stands for an error which occur during the operation/testing of a vehicle – scope: affected Electronic Control Unit (ECU) Company specific system
.xml
Specific information regarding the tested vehicle Specifications of the hardware and software configurations used in the tested vehicle Company specific system
.xml
Vehicle architecture 200% summary of functions, components, bus, signals, hardware and software Company specific system
.json
Data definition As-is-state of signals, sender-/receiver-ECUs as well as the defined bits Company specific system
.arxml

Engineering success in action

See how industry leaders steer projects
confidently and unlock innovation with SPREAD.  
Mitigating €2B SOP risk at a leading automotive OEM
European Auto OEM ensured planned SOP and time-to-market, while saving >€20m of costs
>€20M+
through error reduction & delay avoidance
60%
faster troubleshooting via interdependency clarity
€2B
risk mitigated through SOP assurance
Learn more

FAQ

What is Engineering Intelligence ?

SPREAD’s Engineering Intelligence is a specialized network of AI agents designed specifically for engineers. It is built on three core layers: Rapid Date Ingestion: Connectors integrate data from diverse engineering tools, creating a unified environment where AI agents access structured and unstructured data. Product Twin (PT): Powered by a robust Knowledge Graph, the PT is a digital replica of each product that organizes and contextualizes data, offering a single source of truth. It enables AI agents to analyze product relationships, anticipate challenges, and deliver context-aware insights. Action Cloud: This processing hub is where SPREAD’s AI agents operate, automating tasks like compliance checks, requirements optimization, and error management. Together, these layers enable engineers to focus on innovation while Agentic EI manages the data-intensive tasks.

What is an Engineering Intelligence Graph (EI Graph) ?

The Engineering Intelligence Graph (EI Graph) is the core technology behind SPREAD, mapping and linking various data points and relationships within product data to provide a comprehensive and actionable overview. If you like to learn more about it, please watch our video: Introduction to GraphQL.

What types of data does SPREAD connect and analyze?

The solution pulls from a variety of data sources, including wiring harness data (such as kbl/vec standards), electronic component data, diagnostic protocols, the Bill of Materials (BOM) and more. This information is processed to provide detailed, VIN-specific diagnostics and troubleshooting.

How does SPREAD E/E Inspector integrate with existing systems, including PLMs and PDMs?

SPREAD E/E Inspector Solution for Guided Troubleshooting in Production seamlessly integrates with your existing diagnostic tools, wiring harness data, engineering databases, and Product Lifecycle Management (PLM) or Product Data Management (PDM) systems. By pulling data directly from BOM, ECU communication networks, and diagnostic protocols, the solution bridges the gap between R&D, Production, and Aftermarket phases. It ensures that any product changes in the PLM/PDM system are reflected within SPREAD, allowing for real-time updates and vehicle-specific diagnostics.

What kinds of errors can SPREAD E/E Inspector detect?

SPREAD E/E Inspector can detect a wide range of errors, including:

  • Communication errors between control units (ECUs)
  • Ground and supply errors
  • Hardware/software mismatches in installed components
  • Component failures detected during diagnostic tests
  • Test errors, such as interrupted or abandoned diagnostic procedures

Can SPREAD E/E Inspector be customized to meet my specific production requirements?

Yes, SPREAD E/E Inspector Solution for Guided Troubleshooting in Production can be tailored to fit your specific needs. Whether it’s integrating with your existing toolchain, customizing error detection rules, or adjusting visualization preferences, the solution is highly flexible. You can also use our platform to build your own cloud-based solutions for specific use cases.

How does SPREAD E/E Inspector improve troubleshooting for connectors?

SPREAD E/E Inspector provides real-time tracking of signal paths between connectors and components. Technicians can view detailed wiring and signal diagrams, including pin-level data and connector housing specifications, allowing for quick identification and replacement of faulty connectors.

How does SPREAD E/E Inspector update with changes in vehicle design or manufacturing?

SPREAD E/E Inspector continuously updates based on the latest engineering and manufacturing data. Whenever there’s a change in the BOM or wiring configuration, the solution automatically reflects these updates in the VIN-specific diagrams and troubleshooting protocols.

Can you show me how the solution works?

Yes, we'd be happy to schedule a follow-up meeting to demonstrate how Guided Troubleshooting in Production can integrate with your workflow. Reach out to us through our website or contact our team directly to book your session.

What types of data does SPREAD E/E Inspector connect and analyze?

SPREAD E/E Inspector integrates data from ticketing systems, PLM databases, and release tools. Examples include:

  • Issue tickets: Problems, part numbers, release references.
  • Component data: Hierarchies, dependencies, and function mappings.
  • Signal data: Path descriptions, communication buses, and signal flows.
Release information: Version dependencies and Verbundrelease data.

How does SPREAD E/E Inspector integrate with existing systems, including PLMs and PDMs?

SPREAD’s E/E Inspector in R&D integrates seamlessly with PLM, ticketing systems, and engineering platforms. The tool syncs real-time changes in product or release data, providing traceability across tickets and engineering workflows for proactive diagnostics.

What kinds of errors can SPREAD E/E Inspector detect?

SPREAD E/E Inspector can detect a wide range of errors, including:

  • Mismatched software and hardware dependencies.
  • Component or function failures linked to signals.
  • Errors in release configurations or batch releases testing.
  • Recurring quality issues across functions or components.

Can SPREAD E/E Inspector be customized to meet my specific R&D requirements?

Yes, SPREAD allows flexibility in defining workflows, ticket ingestion, and visualization of dependencies. This ensures the solution aligns with your R&D toolchain and engineering goals.

How does SPREAD E/E Inspector assist with recurring ticket analysis?

SPREAD E/E Inspector highlights recurring issues by linking tickets to shared components, functions, and dependencies. Teams can view patterns in recurring tickets, enabling earlier identification of systemic problems and reducing testing bottlenecks.

How does SPREAD E/E Inspector stay updated with product and release changes?

SPREAD E/E Inspector continuously syncs with ticketing and release systems. When changes occur, it dynamically updates dependencies, enabling real-time diagnostics for any new issues linked to tickets or product data.

Can you show me how SPREAD E/E Inspector works?

Yes, we'd be happy to schedule a follow-up meeting to demonstrate how the solution can integrate with your workflow. Reach out to us through our website or contact our team directly to book your session.

What types of data does SPREAD E/E Inspector connect and analyze?

E/E Inspector pulls from a variety of data sources, including wiring harness data (such as kbl/vec standards), electronic component data, diagnostic protocols, the Bill of Materials (BOM) and more. This information is processed to provide detailed, VIN-specific diagnostics and troubleshooting.

How does E/E Inspector integrate with existing systems, including PLMs and PDMs?

SPREAD E/E Inspector in Aftermarket seamlessly integrates with your existing diagnostic tools, wiring harness data, engineering databases, and Product Lifecycle Management (PLM) or Product Data Management (PDM) systems. By pulling data directly from BOM, ECU communication networks, and diagnostic protocols, the solution bridges the gap between R&D, Production, and Aftermarket phases. It ensures that any product changes in the PLM/PDM system are reflected within SPREAD, allowing for real-time updates and vehicle-specific diagnostics.

What kinds of errors can E/E Inspector detect?

The solution can detect a wide range of errors, including:

  • Communication errors between control units (ECUs)
  • Ground and supply errors
  • Hardware/software mismatches in installed components
  • Component failures detected during diagnostic tests
  • Test errors, such as interrupted or abandoned diagnostic procedures

Can E/E Inspector be customized to meet my specific Aftermarket requirements?

Yes, E/E Inspector in Aftermarket can be tailored to fit your specific needs. Whether it’s integrating with your existing toolchain, customizing error detection rules, or adjusting visualization preferences, the solution is highly flexible. You can also use our platform to build your own cloud-based solutions for specific use cases.

How does E/E Inspector improve troubleshooting for connectors?

E/E Inspector provides real-time tracking of signal paths between connectors and components. Technicians can view detailed wiring and signal diagrams, including pin-level data and connector housing specifications, allowing for quick identification and replacement of faulty connectors.

How does E/E Inspector update with changes in vehicle design or manufacturing?

The solution continuously updates based on the latest engineering and manufacturing data. Whenever there’s a change in the BOM or wiring configuration, the solution automatically reflects these updates in the VIN-specific diagrams and troubleshooting protocols.

Can you show me how E/E Inspector works?

Yes, we'd be happy to schedule a follow-up meeting to demonstrate how E/E Inspector in Aftermarket can integrate with your workflow. Reach out to us through our website or contact our team directly to book your session.

How to

get started

1

Jointly scope
use cases

We bring practical expertise to understand your challenges and scope the right solutions  with you.

2

Deploy solutions
rapidly

Within weeks we deploy our platform, integrate the required product data and configure the defined solutions.

3

Rollout across
the company

We train users across teams, scale company-wide, and support you continuously on the way.