Guide troubleshooting for improved first-pass yields
Link errors in production to system dependencies for faster resolution of E/E issues. Enable teams to uncover root causes, reduce downtime and increase first-pass yields.
What can you achieve with this use case?
Trusted by


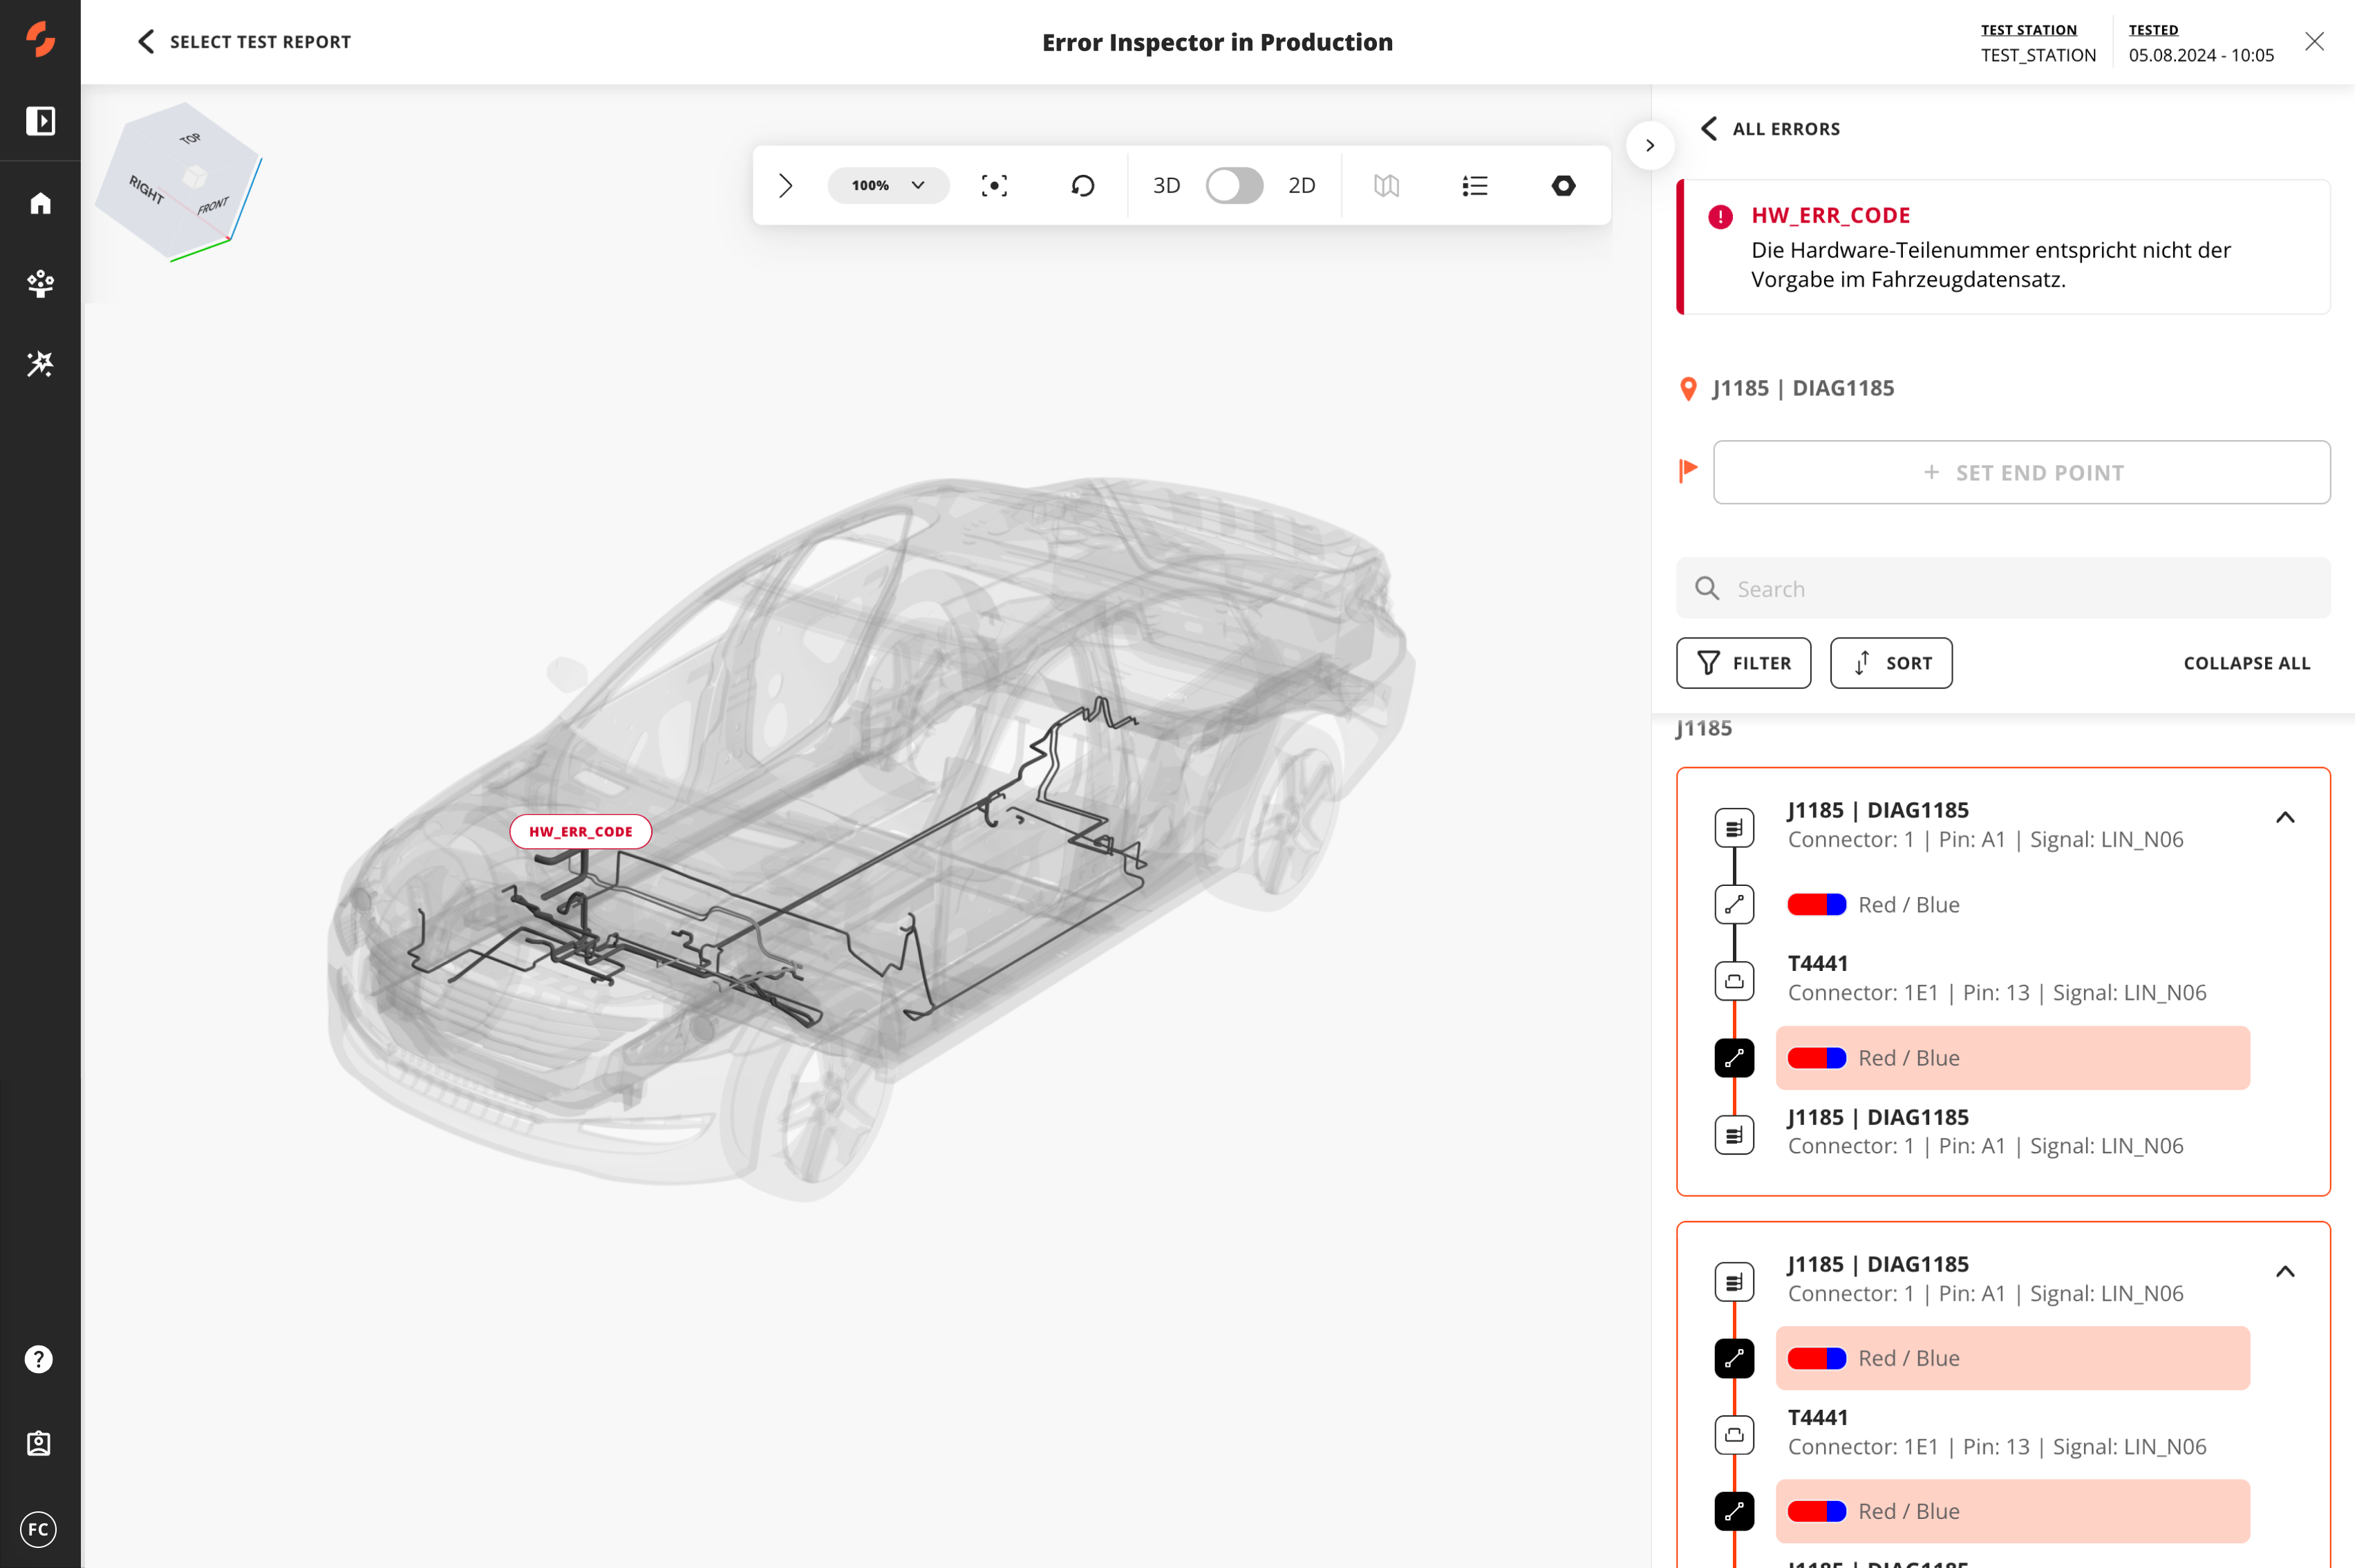
VIN-specific 3D signal explorer
Your teams can search for electric components in 3D, find communication partners and locate signal paths at a VIN-specific level. Instead of the 150% model covering all possible variants, we ensure that only components that are installed are displayed.
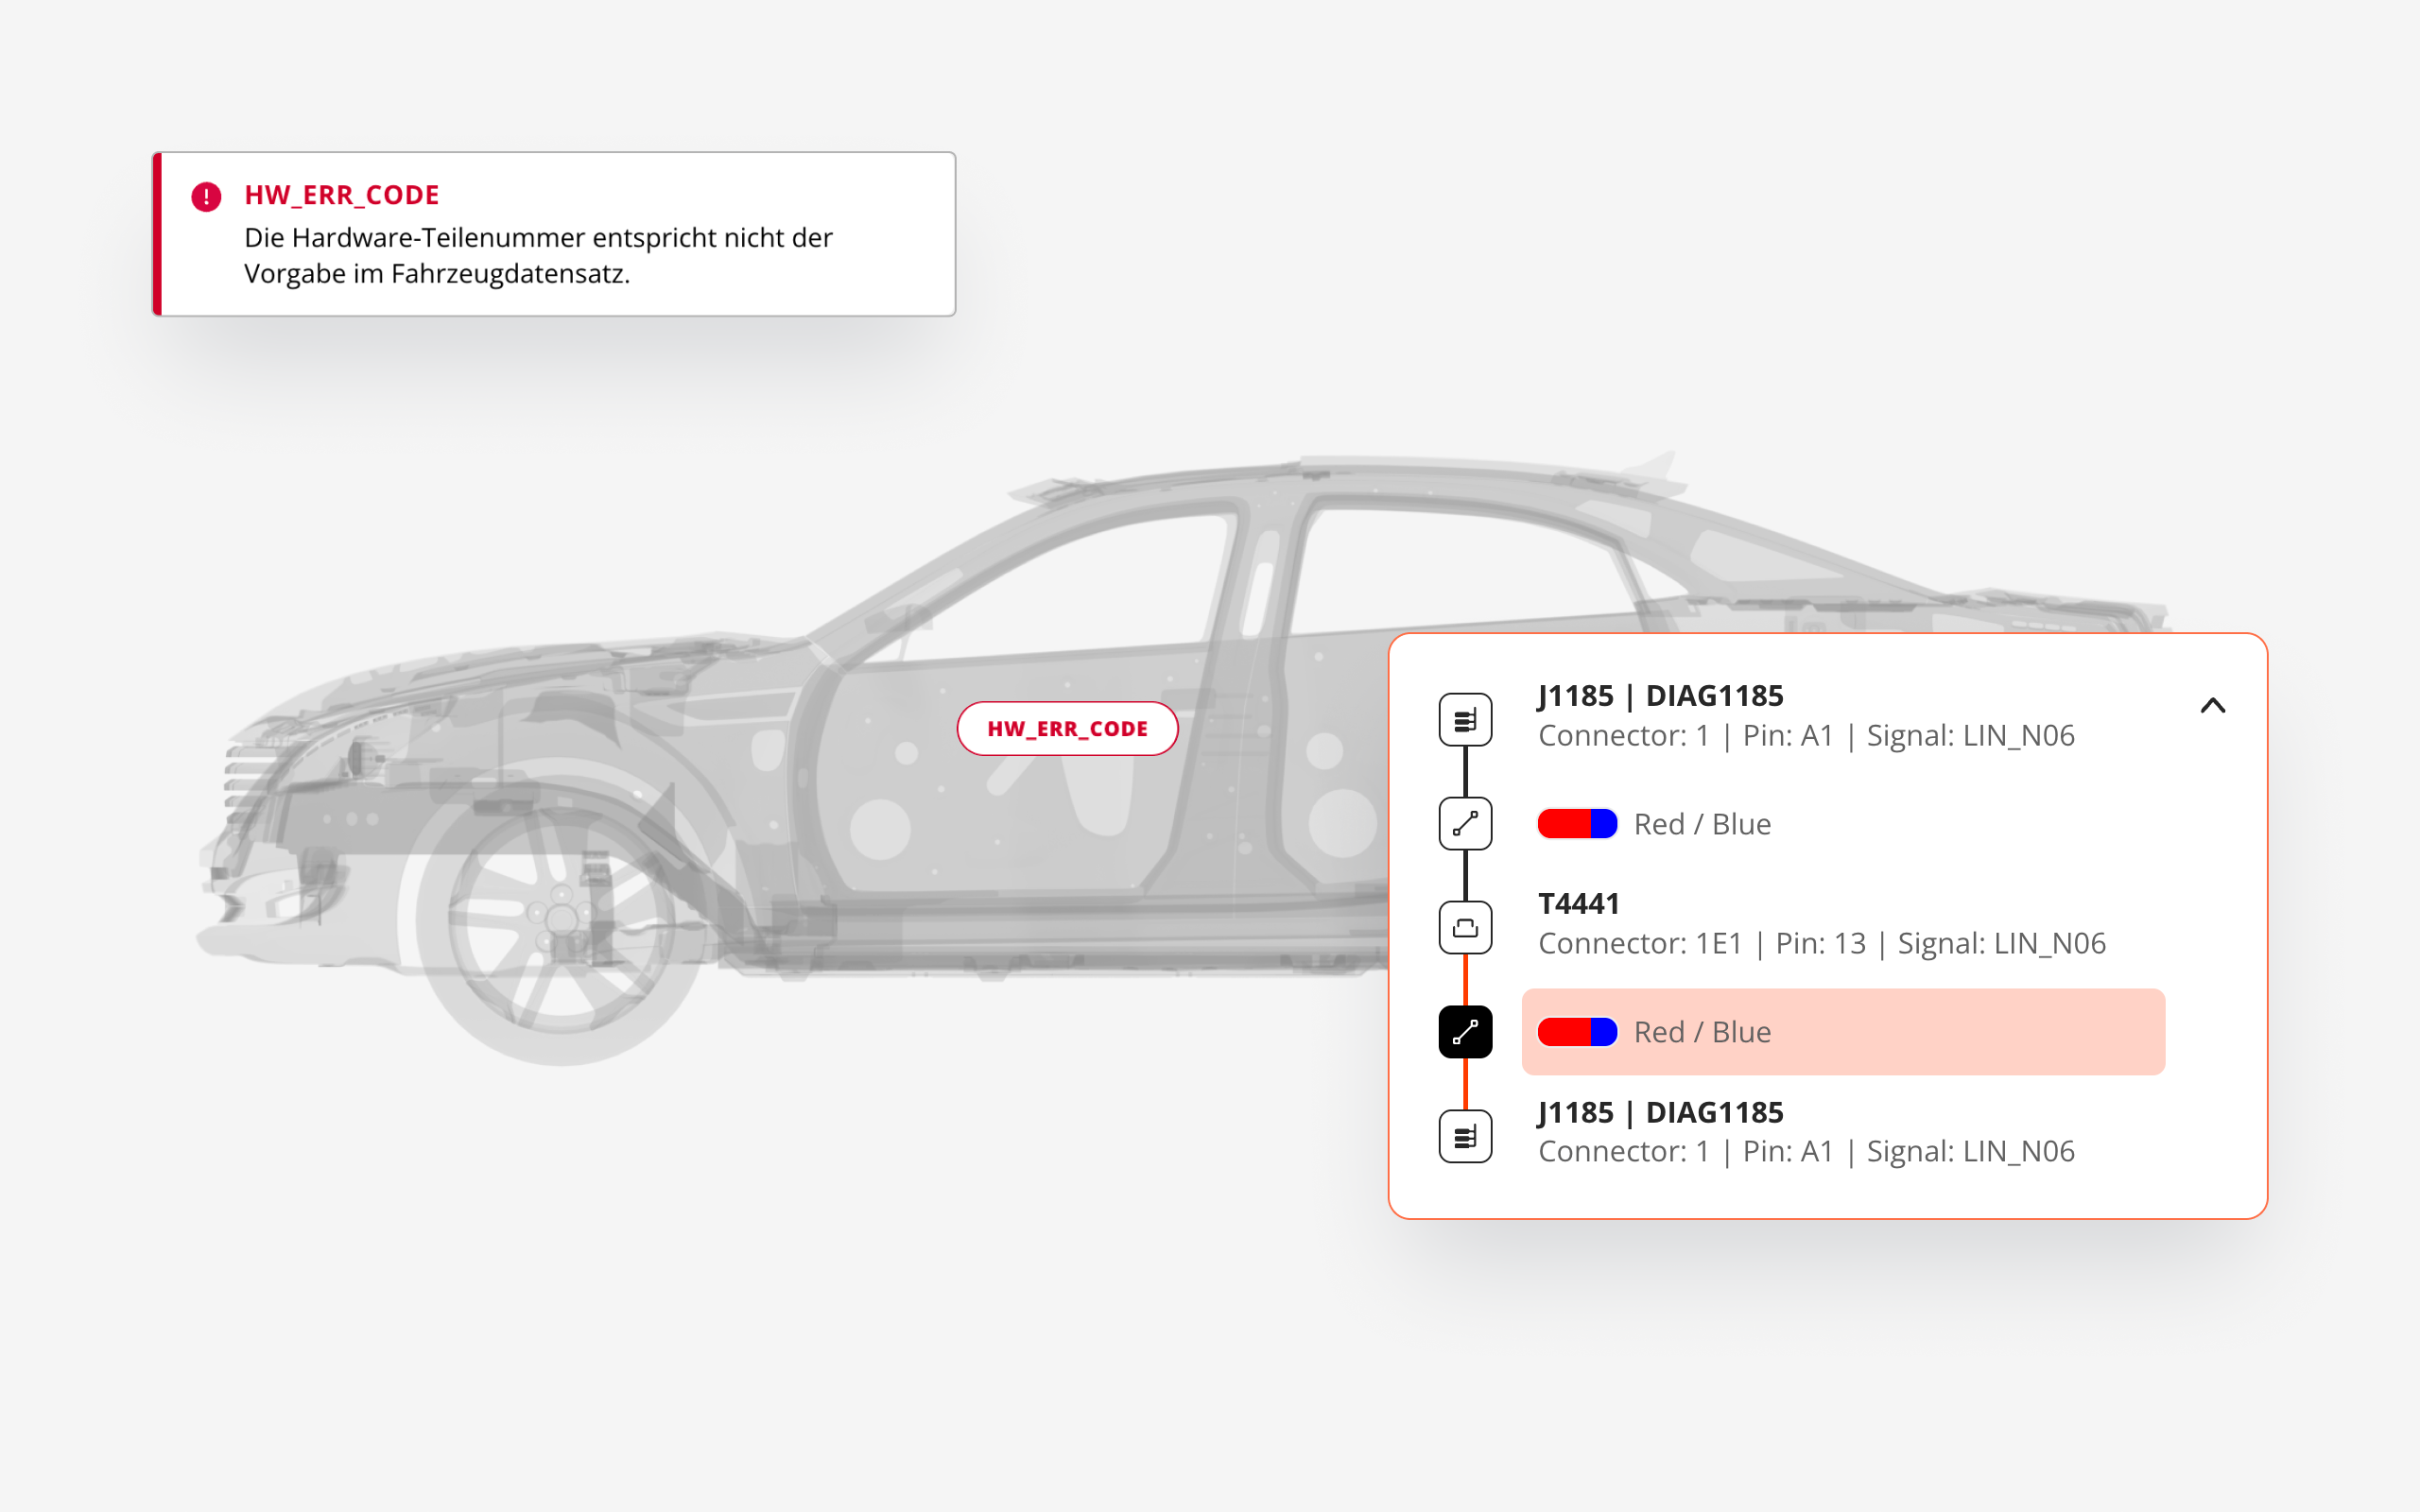
Focus analysis ranks root cause
A focus analysis correlates DTC timelines, signal anomalies and network topology, then ranks the most probable ECU or connector and displays the supporting evidence for fast, confident action.
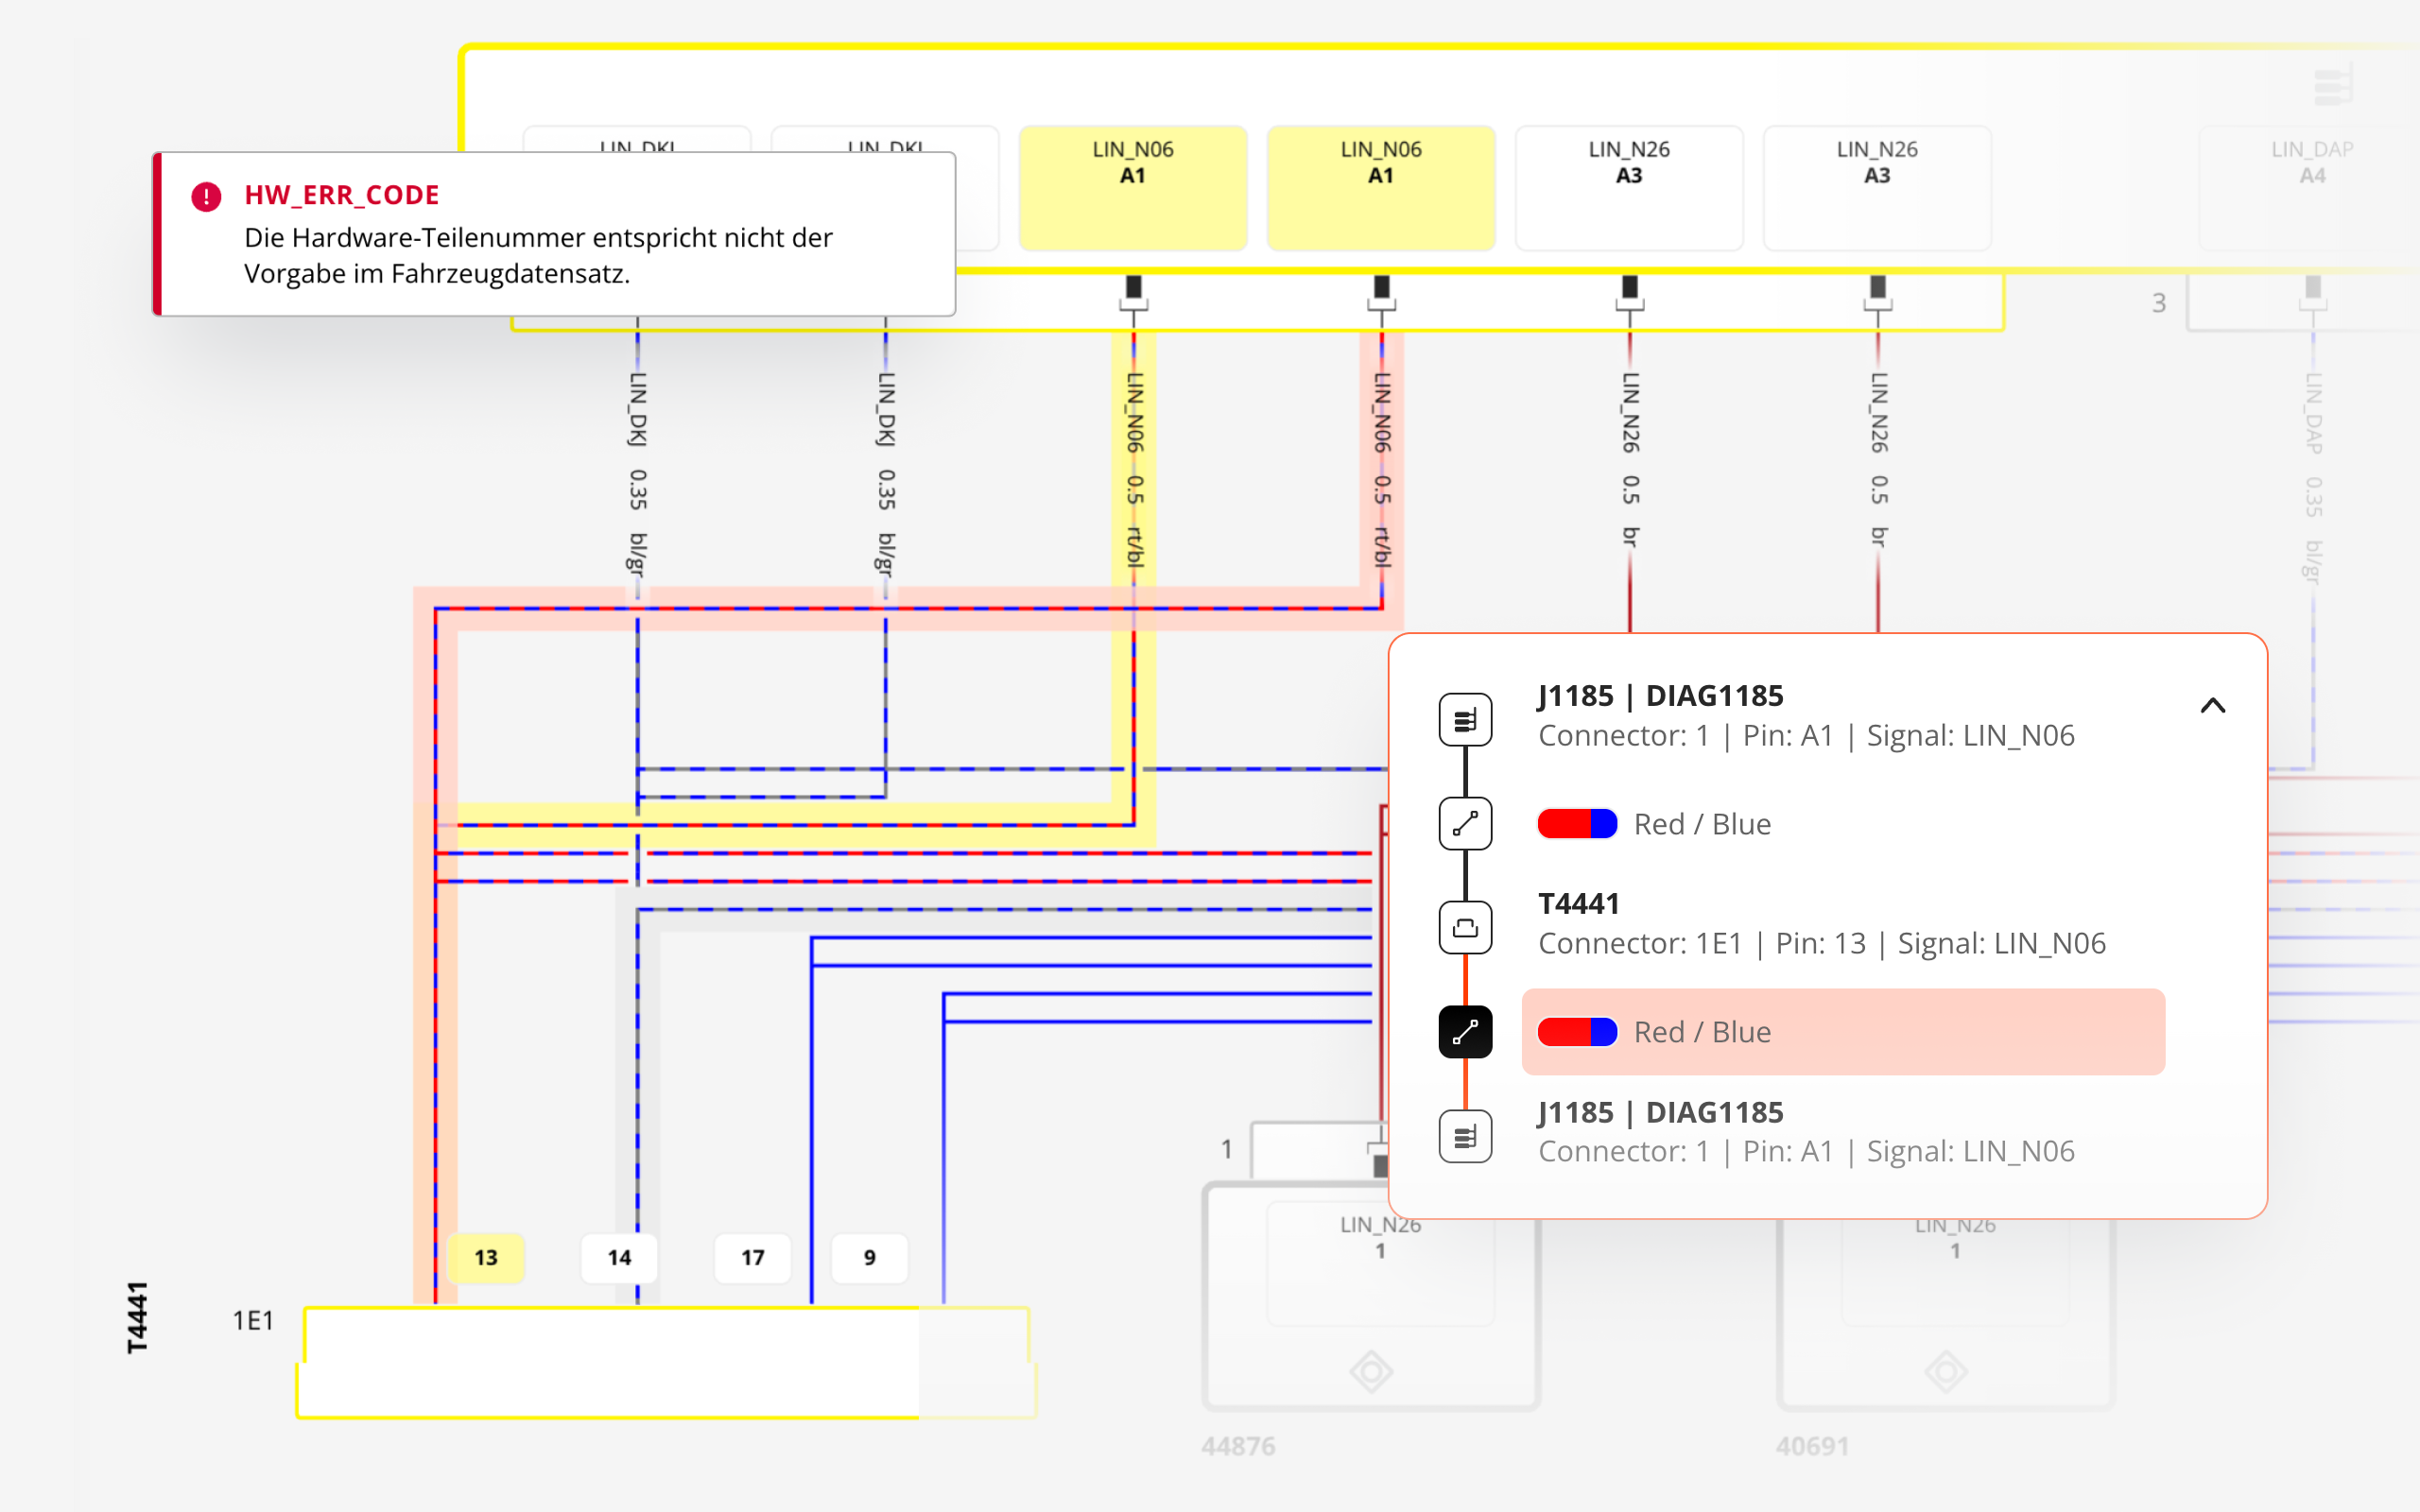
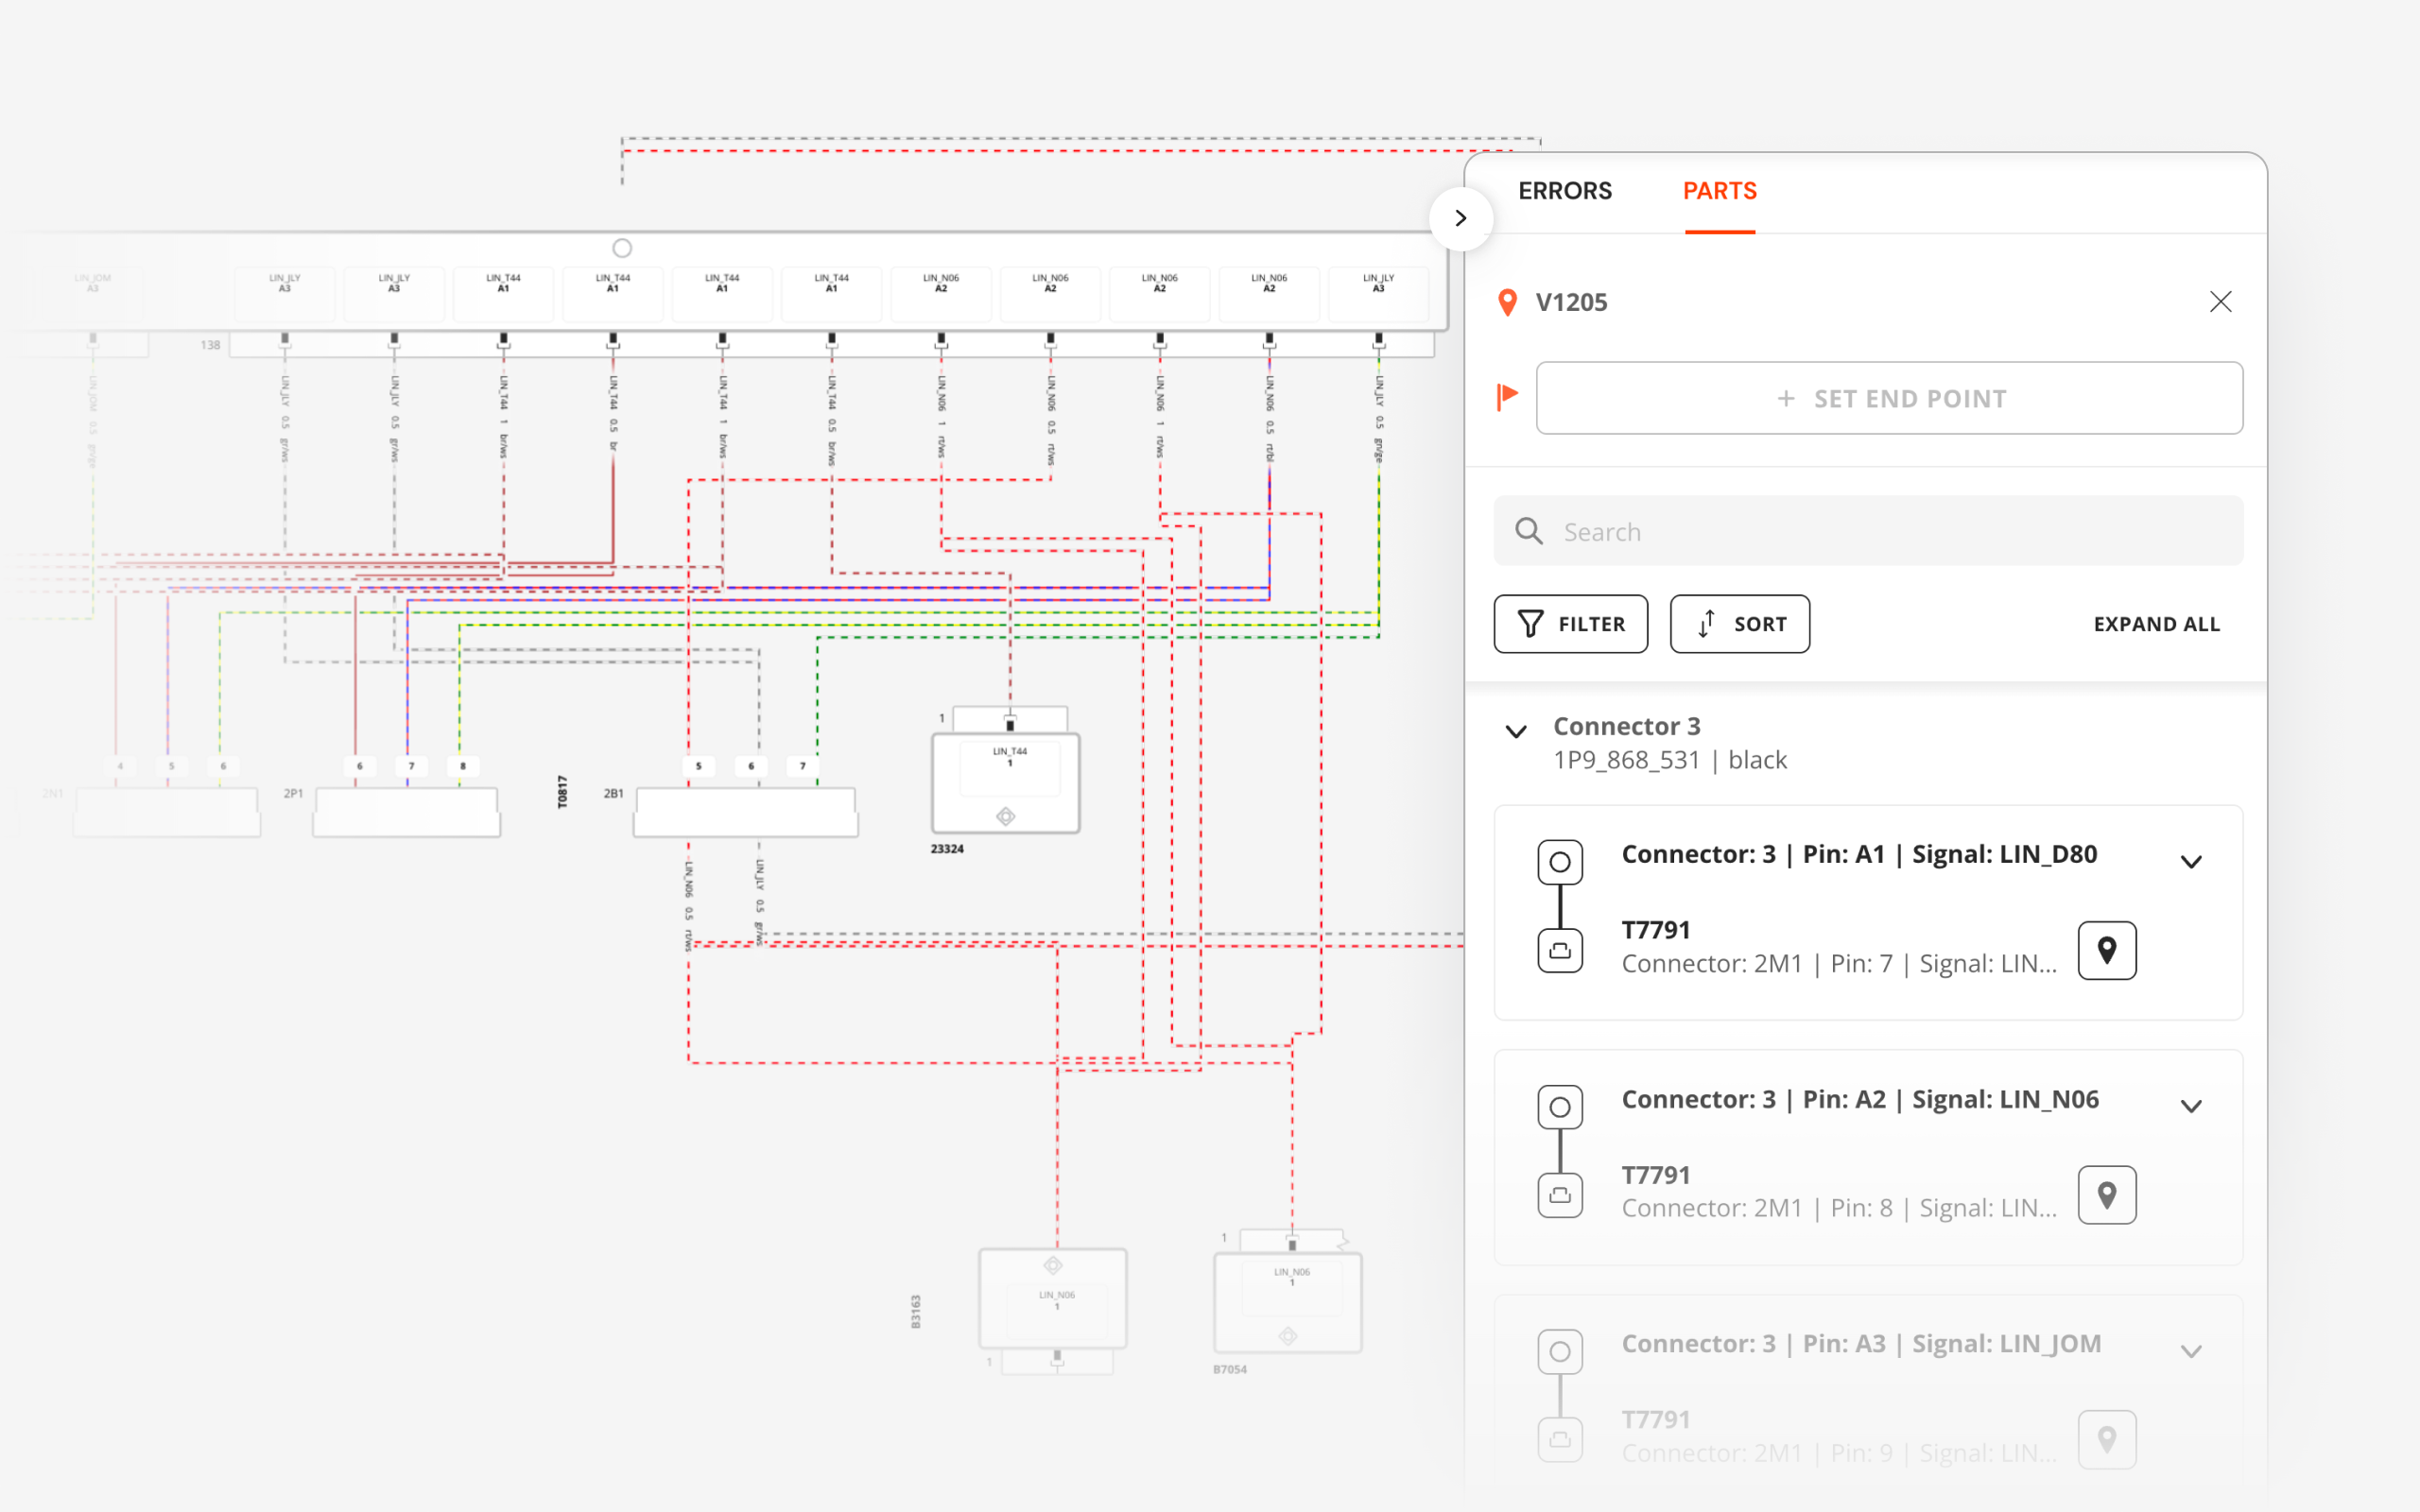
Wire-level 2D troubleshooting
Users pivot instantly between VIN-filtered 3D locations and detailed 2D schematics, pinpointing the exact wires and connectors to test, without context switching.
Get an instant tour
See how SPREAD turns complex product data into clear, actionable insights. Take a quick tour and see how this solutions deliver impact.
Get an Instant Tour
By submitting you agree to our privacy policy.
What types of data does SPREAD connect and analyze?
SPREAD Inspector integrates critical Production data from multiple engineering systems and unstructured sources to provide complete traceability from issues to root cause. It connects and contextualizes:
| Data Type | Description | Typical sources | File Formats needed |
|---|---|---|---|
| Wiring-harness topology | Pin-to-pin connectivity, module & connector part-numbers, wire colours/lengths, splice & ground points – the backbone for path-finding and VIN filtering. | Harness engineering (KBL/VeC authoring tools, PDM) |
.kbl
.vec
.xml
|
| BoM + configuration codes | 150 % parts list plus variant / feature codes that let the solution cut the harness to the exact VIN build. | ERP / MES / BoM databases |
.xls(x)
.csv
.xml
|
| Diagnostic test results | Tester log with VIN, station, time-stamp, ECU IDs, triggered DTCs & error texts – the starting point for every investigation. | Company specific system |
.json
.xml
|
| Geometry & schematics | Lightweight 3D shell, optional harness JT, and 2D wiring diagrams (pins, grounds, splice nodes) for visual drill-down from vehicle to wire. | CAD/PDM for 3D, wiring-diagram authoring |
.jt
.svg
.pdf
.png
|
| Mapping & meta-data | Lookup tables linking harness IDs, DTC IDs, ECU addresses, plus diagnosis specs that define error classes and repair hints. | Company specific system |
.xls(x)
.odx
.pdx
|
Engineering success in action
confidently and unlock innovation with SPREAD.


FAQ
What is Engineering Intelligence ?
SPREAD’s Engineering Intelligence is a specialized network of AI agents designed specifically for engineers. It is built on three core layers: Rapid Date Ingestion: Connectors integrate data from diverse engineering tools, creating a unified environment where AI agents access structured and unstructured data. Product Twin (PT): Powered by a robust Knowledge Graph, the PT is a digital replica of each product that organizes and contextualizes data, offering a single source of truth. It enables AI agents to analyze product relationships, anticipate challenges, and deliver context-aware insights. Action Cloud: This processing hub is where SPREAD’s AI agents operate, automating tasks like compliance checks, requirements optimization, and error management. Together, these layers enable engineers to focus on innovation while Agentic EI manages the data-intensive tasks.
What is an Engineering Intelligence Graph (EI Graph) ?
The Engineering Intelligence Graph (EI Graph) is the core technology behind SPREAD, mapping and linking various data points and relationships within product data to provide a comprehensive and actionable overview. If you like to learn more about it, please watch our video: Introduction to GraphQL.
What types of data does SPREAD E/E Inspector connect and analyze?
SPREAD E/E Inspector integrates data from ticketing systems, PLM databases, and release tools. Examples include:
- Issue tickets: Problems, part numbers, release references.
- Component data: Hierarchies, dependencies, and function mappings.
- Signal data: Path descriptions, communication buses, and signal flows.
How does SPREAD E/E Inspector integrate with existing systems, including PLMs and PDMs?
SPREAD’s E/E Inspector in R&D integrates seamlessly with PLM, ticketing systems, and engineering platforms. The tool syncs real-time changes in product or release data, providing traceability across tickets and engineering workflows for proactive diagnostics.
What kinds of errors can SPREAD E/E Inspector detect?
SPREAD E/E Inspector can detect a wide range of errors, including:
- Mismatched software and hardware dependencies.
- Component or function failures linked to signals.
- Errors in release configurations or batch releases testing.
- Recurring quality issues across functions or components.
Can SPREAD E/E Inspector be customized to meet my specific R&D requirements?
Yes, SPREAD allows flexibility in defining workflows, ticket ingestion, and visualization of dependencies. This ensures the solution aligns with your R&D toolchain and engineering goals.
How does SPREAD E/E Inspector assist with recurring ticket analysis?
SPREAD E/E Inspector highlights recurring issues by linking tickets to shared components, functions, and dependencies. Teams can view patterns in recurring tickets, enabling earlier identification of systemic problems and reducing testing bottlenecks.
How does SPREAD E/E Inspector stay updated with product and release changes?
SPREAD E/E Inspector continuously syncs with ticketing and release systems. When changes occur, it dynamically updates dependencies, enabling real-time diagnostics for any new issues linked to tickets or product data.
Can you show me how SPREAD E/E Inspector works?
Yes, we'd be happy to schedule a follow-up meeting to demonstrate how the solution can integrate with your workflow. Reach out to us through our website or contact our team directly to book your session.
How to
get started
1
Jointly scope
use cases
We bring practical expertise to understand your challenges and scope the right solutions with you.
2
Deploy solutions
rapidly
Within weeks we deploy our platform, integrate the required product data and configure the defined solutions.
3
Rollout across
the company
We train users across teams, scale company-wide, and support you continuously on the way.